
 Customer Support


Somewhere in your budget season, someone is going to pull up the amenity satisfaction scores, land on pet amenities sitting dead last, and ask why you’re still funding a dog run that residents apparently don’t even like.
It’s a reasonable question if you’re only looking at one number. Pull a second one and the answer flips.
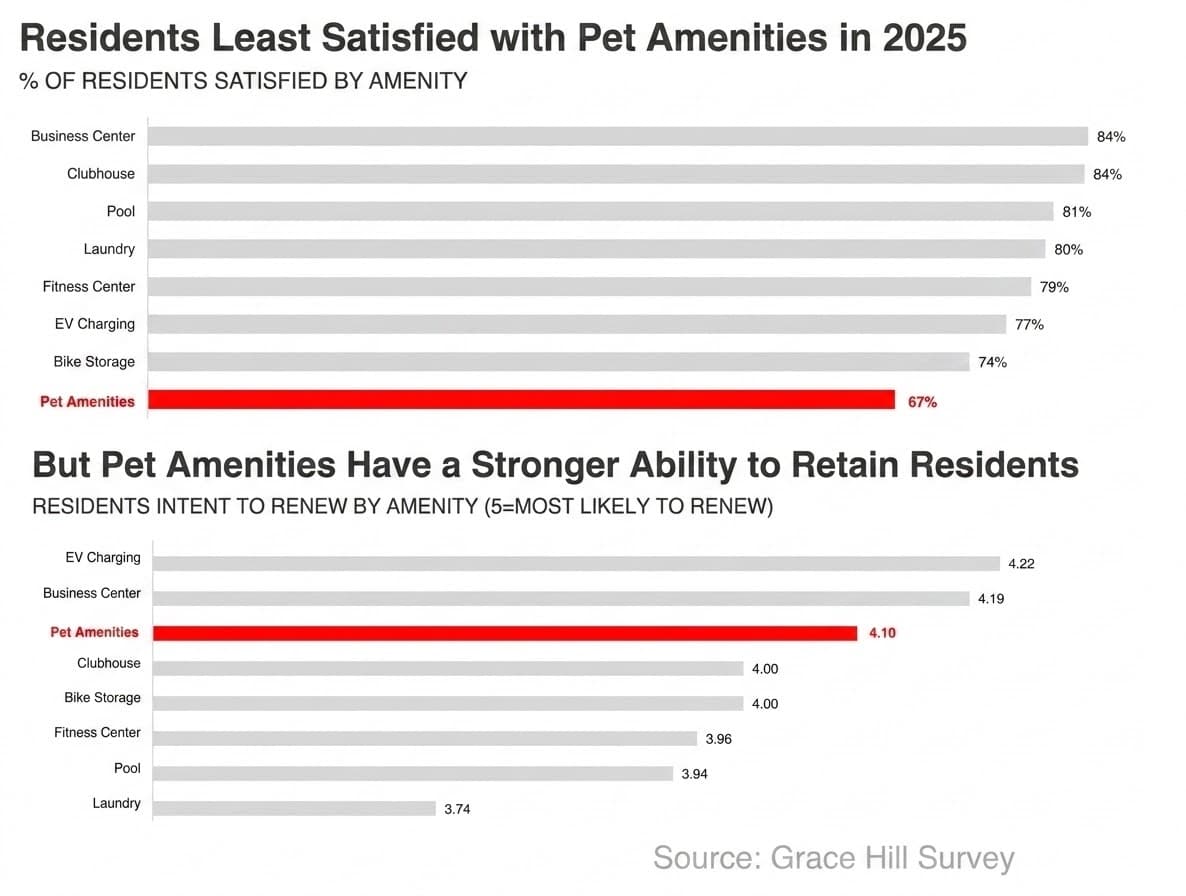
Pet amenities come in at 67% satisfaction in Grace Hill’s 2025 survey data. Dead last, behind pools, clubhouses, laundry, and business centers.
Residents with access to pet amenities post a renewal intent of 4.10, with 5 being the highest, most valued score. Meaning pet amenities got third place. Ahead of the pool at 3.94, ahead of laundry at 3.74, ahead of nearly everything measured.
Same amenity. Same residents. Two numbers pointing in opposite directions.
I’d love to tell you this is a fluke, but it isn’t. It’s the whole argument behind Grace Hill’s 2026 Amenity Paradox report, and pet amenities clearly define it.
Why the Amenity Everyone Complains About Is the One Nobody Wants to Live Without
Here’s the thing about satisfaction scores that gets lost every budget cycle: they measure whether an experience met expectations, not whether residents rely on it.
A pool is optional. Nobody’s life falls apart if the pool is closed for a week. A dog run is not optional if you have a dog, and dogs, unlike pools, do not care that it’s raining, that the gate sticks, or that the leasing office is short-staffed this week. They need to go outside. Every day. That’s the whole agreement when you’re a dog parent.
Gatewise access data backs this up in a way that’s hard to argue with: pet-related amenities post the highest per-unit daily usage of anything we measured, 0.51 opens per unit in Q1, almost double the gym and more than triple the pool. Residents are opening that gate because the dog is standing by the door, and the dog does not negotiate.
That frequency is exactly why the satisfaction score is low. When something becomes part of a daily routine, residents notice every flaw in it, because they’re interacting with those flaws constantly. The gate that doesn’t latch. The waste station that’s always empty right when you need it. The patch of grass that never quite recovers no matter how many times it gets reseeded.
None of that shows up on a pool visited twice a month. All of it shows up on a dog run visited twice a day.
EV Charging, Same Story, Different Parking Spot
EV charging is the third-lowest-rated amenity in the report, at 77% satisfaction.
It also carries the highest renewal intent Grace Hill tracked: 4.22.
Different amenity, identical mechanism. The features tied to a daily routine drive renewal far harder than their satisfaction scores would ever lead you to guess.
Satisfaction Tells You What Cleared the Bar. It Doesn’t Tell You What Kept Someone There.
If your team is using satisfaction as a stand-in for amenity ROI, pet amenities and EV charging should be enough to stop you. A high score tells you an amenity met expectations. Renewal intent tells you whether it earned another lease.
The rent data arrives at the same place from a different direction. Rent correlation data from HelloData® shows that the most common, highest-rated amenities (laundry rooms, fitness centers, pools, clubhouses, business centers) barely register among the features that actually move rent. They’ve become standard enough that residents assume they’re there. Having them doesn’t differentiate a property, and missing them is rare enough that it barely registers as risk.
What moves rent is what still signals something distinct: elevators, hardwood floors, views, doorman service.
What erodes rent is a resident noticing that what’s there falls short of what they pictured. Washer/dryer hookups where they wanted in-unit laundry. Carpet where they wanted hard flooring.
Put satisfaction, usage, and rent up next to each other and you get a picture of amenity value that none of them gives you alone. Value comes from meeting the expectation consistently on the handful of things residents lean on every single day. And it comes from noticing that “residents complain about this” and “residents don’t need this” are two different sentences. Multifamily budgets get built on the wrong one more often than I’d like.
Before You Touch That Line Item
If a pet amenity or an EV charger is sitting at the bottom of your satisfaction rankings, pull three numbers before anything gets cut: satisfaction, renewal intent, usage. The thing that looks like an underperformer on a satisfaction chart may be one of the few things keeping people from giving notice.
A gate that sticks and a charging station that’s down half the time are maintenance problems with maintenance fixes. Fix the gate before you cut the amenity.
And if you’re benchmarking your amenity mix against what everyone else in your market already has, you’re benchmarking to the floor. Pools and clubhouses are table stakes precisely because everyone has them, which is exactly why they’ve stopped moving rent or renewal on their own.
There’s a Lot More of This in the Full Report
Pet amenities and EV charging are two data points inside a much bigger finding. The 2026 Amenity Paradox report pulls together Grace Hill survey data from 7.3 million residents and prospects, Gatewise usage data from 500,000+ multifamily units, and HelloData® rent data across 192,400+ properties to answer a harder question than “what amenities do residents want?” It gets at what actually creates value, for whom, and why satisfaction scores alone won’t tell you that.
If your 2027 amenity budget is starting to take shape, this is the data I’d want in front of me before anything gets locked in.