

 Customer Support


We went into this month looking for a back-to-school noise problem.
It makes sense, in theory. August should be the loudest part of the year on any property with kids — moving trucks jockeying for the loading zone, first-day-of-school photos taken on the stairwell landing because the light’s better there, and a leasing office getting asked, in five increasingly polite ways, whether someone could maybe enforce quiet hours this week specifically. If bigger, family-sized units were ever going to show up as a liability on a satisfaction survey, this felt like the time it would announce itself.
So we went looking for that problem. We didn’t find it.
Here’s what happened. We tested whether bigger, family-sized apartments come with a satisfaction cost, across eight different measures, using both our Grace Hill Survey data and a HelloData market data cross-check.
The Theory: More Bedrooms = More Complaints
The logic seemed sound going in. Put simply, more bedrooms generally means more people, more noise, more foot traffic, more packages piling up during back-to-school shopping season. If any renter segment was going to show up unhappier on those specific measures, it should be households in larger units.
The Test: 2,954 Properties, 91 Markets, 8 Measures
We pulled current unit-mix data — the bedroom composition of each property — through HelloData, matched it against a sample of 2,954 of our own surveyed properties across 91 markets, and correlated it against eight separate satisfaction measures: overall satisfaction, amenities, noise level, package delivery, maintenance, renewal intentions, value for the rent paid, and likelihood to recommend.
Across all eight, the relationship was somewhere between negligible and nonexistent. Noise level, package delivery, and renewal intentions showed no meaningful relationship to unit size. The other five measures — overall satisfaction, amenities, maintenance, value for the rent paid, and likelihood to recommend — showed a technically significant but tiny effect. Even the strongest relationship explained only about 1% of the variation, the kind of result you get from having thousands of data points rather than from anything a resident would actually notice day to day.
In plain terms: we could not find a “bigger units, unhappier residents” story anywhere in the numbers. Which meant either the theory was wrong, or we were asking the data the wrong question.
What Residents Are Actually Saying
So we went to the comments. We pulled every open-ended survey response over the last 12 months that mentioned kids, children, school, playgrounds, strollers, daycare, babysitting, or homework — 9,823 comments in total, including exactly 7,600 that used kid- or child-related terms directly. That’s not a rounding error. It’s a large enough body of feedback to reveal clear patterns.
Two things jumped out once we split those comments by which question they came from: 1) the ones that asked “what do you enjoy most,” versus 2) the ones that asked “how could this be better” or “what issues have you had.”
School proximity is mostly a love letter, not a complaint. Among the 1,254 school-related comments submitted through the positive, improvement, and issues questions, nearly two-thirds — 65.8% — came from the positive, “what do you enjoy” question. Residents are giving the property credit for one of its most valuable advantages: a location that makes everyday family life easier. “Being close to stores and schools.” “Great location close to great schools.” “The location is also a big plus because it’s convenient for work, schools, and shopping.” Nobody’s asking you to fix the school district. They’re thanking you for picking a good address.
The playground, on the other hand, is almost entirely a request, not a compliment. Among the 978 playground-related comments submitted through those same question types, 81.1% came from the improvement and issues questions. That’s close to the inverse of the school pattern. “Add a playground for the children by the pool.” “A playground would be good for kids as well.” “Families would like to see more playground/larger play structures in the areas for children and another dog park for the other side.” This is about as close to a resident handing you a to-do list as survey data gets.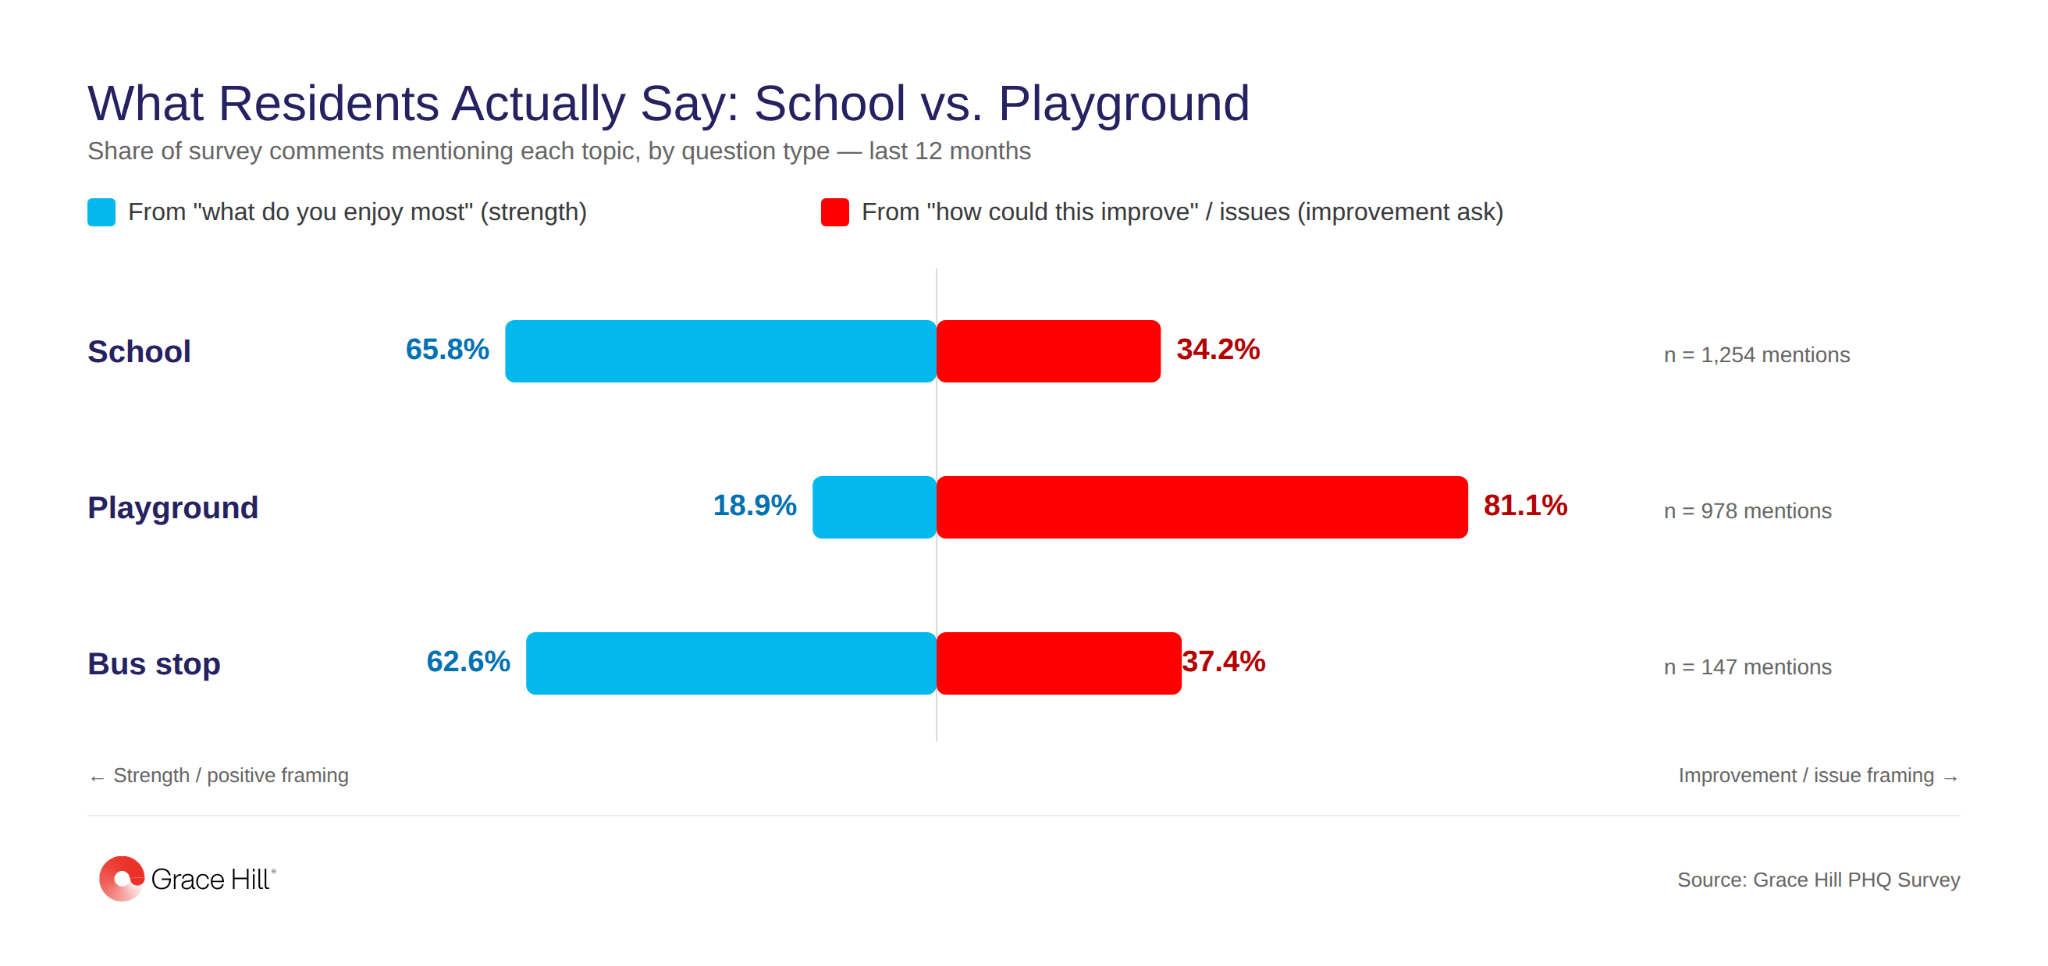
That finding also echoes what we saw in our 2026 Amenity Paradox Report: the amenities residents value most aren’t necessarily the flashiest ones. They’re the ones that fit into daily life and solve a real need. For families, a playground is a pretty literal example.
We also checked whether any of this spikes seasonally, the way the back-to-school framing would predict. It doesn’t. Family-related comment volume varies throughout the year, but August and September are not meaningfully elevated. So the honest version of this story isn’t “back-to-school season creates a problem.” It’s “this has been sitting in your survey data all year.”
Why It Matters: This Is a Retention Story, Not Just an Amenities One
There is a reasonable industry case that households with school-age kids may be more reluctant to move because enrollment, routines, and a kid’s friend group can all raise the cost of leaving. This analysis does not prove that retention effect. What it does show is that the mismatch residents describe isn’t primarily noise or space. It’s a specific, physical amenity gap they have been naming for you, for free, in a comment box, all year.
This is exactly the segmentation problem your resident satisfaction survey data can solve and mostly hasn’t been asked to. Aggregate satisfaction scores can look perfectly healthy while masking a specific, addressable ask sitting in the comments underneath them. If you haven’t pulled your own open-ended responses and searched them for these kinds of unprompted, unscored themes, you’re probably missing a version of this story specific to your own portfolio. (Ask us how.)
If you want help running this same cut on your own survey data — or want to see how HelloData can cross-reference your properties against market-level data the way we did here — talk to our team. We’ll show you exactly how we built this.